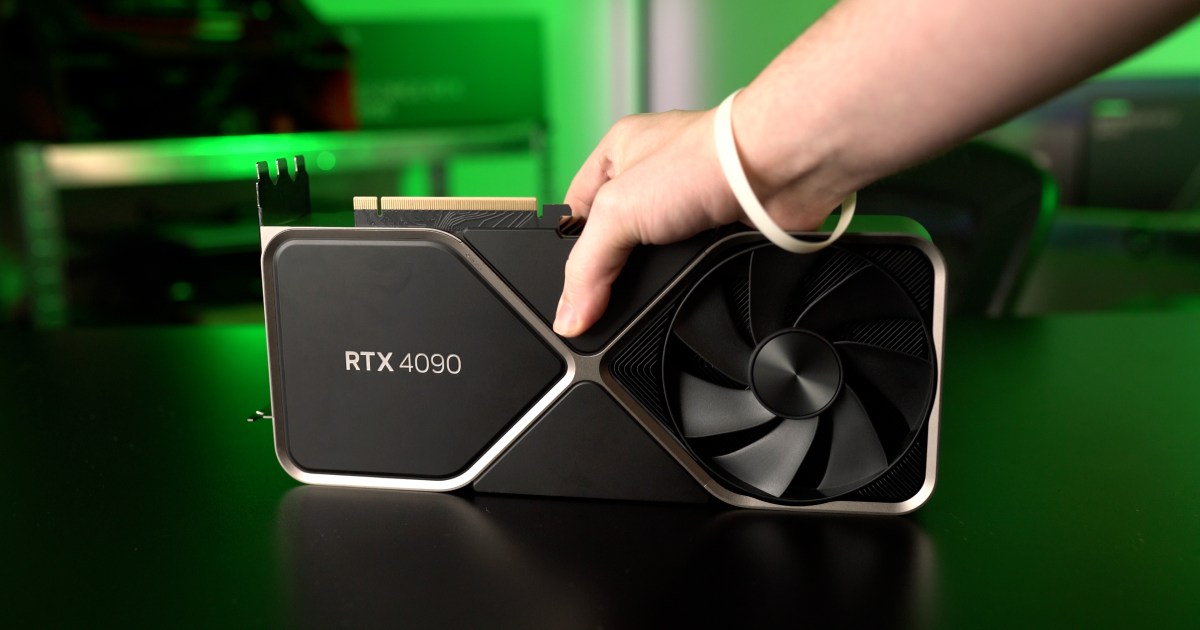
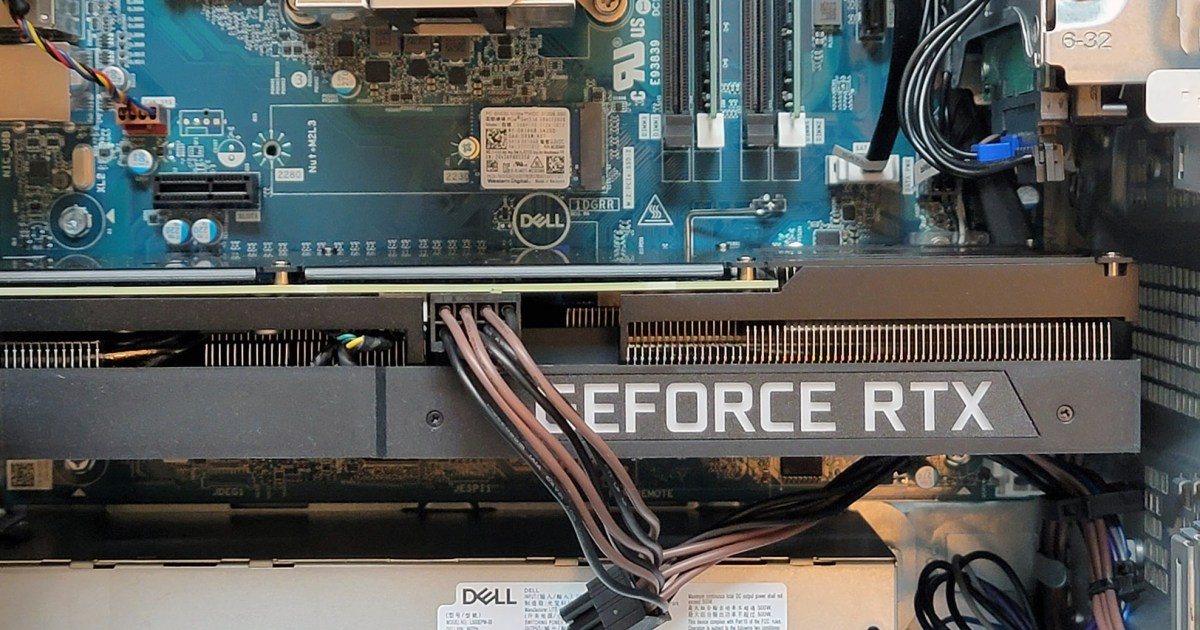
Your graphics card, or GPU, is vital for a smooth gaming experience. Regularly checking its temperature is crucial for maintaining performance and extending its lifespan. Temperature is a key factor influencing a GPU’s degradation, and with graphics cards being a significant investment, ensuring their longevity is essential. This guide will show you how to monitor your GPU temperature effectively and what to do if things get too hot.
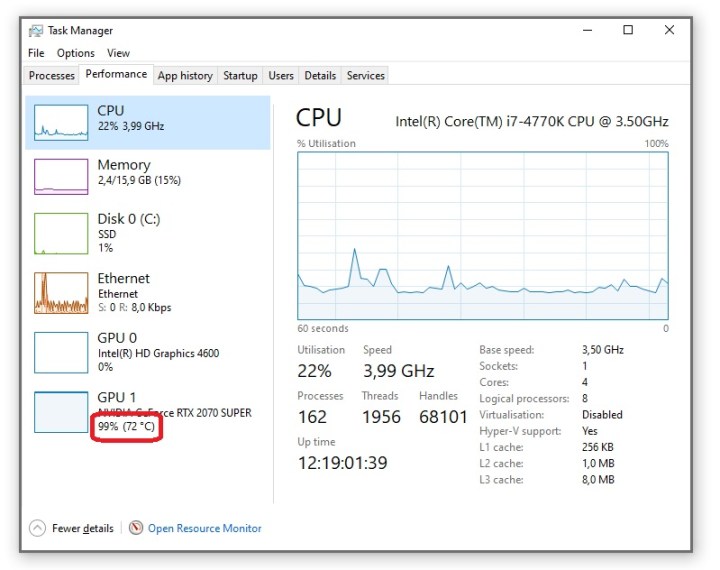 Windows Task Manager showing GPU temperature.Alt text: Screenshot of Windows Task Manager displaying GPU temperature.
Simple GPU Temperature Monitoring Methods
Windows Task Manager offers the easiest way to quickly check your GPU temperature. Open Task Manager, navigate to the Performance tab, and locate your GPU at the bottom of the list. Its temperature will be displayed in brackets. This method is useful for checking temperatures under a heavy gaming load, ensuring your GPU is operating near 100% utilization.
However, Task Manager isn’t ideal for real-time, in-game monitoring. Alt-tabbing out of a game causes the GPU temperature to drop instantly, making it difficult to get an accurate reading during gameplay unless you have a second monitor.
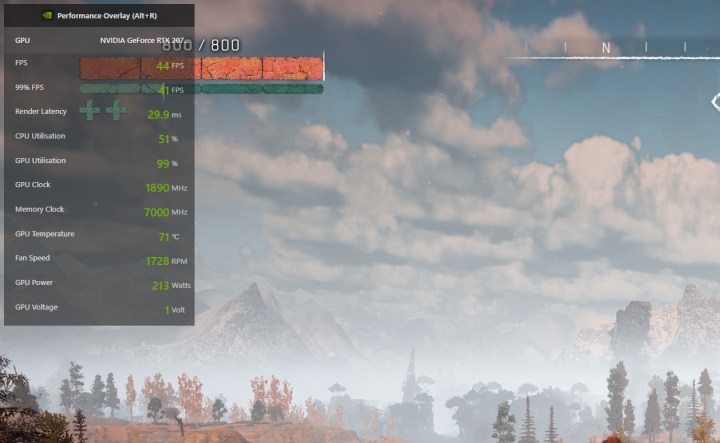 In-game GPU temperature monitoring.Alt text: Screenshot of in-game GPU temperature monitoring using Nvidia’s GeForce Experience overlay.
Fortunately, both Nvidia and AMD offer in-game overlays for monitoring hardware performance. For Nvidia GPUs, ensure GeForce Experience is installed and you’re logged in. Press Alt + Z to open the overlay in-game, click the Cog icon, and configure the performance monitor. This overlay displays real-time data, including GPU temperature. AMD GPUs have a similar utility. Third-party monitoring tools like HWiNFO, MSI Afterburner, and EVGA Precision X1 provide alternative monitoring options.
Stress Testing with Furmark for Accurate Readings
While in-game monitoring is helpful, it doesn’t provide a completely accurate picture of your GPU’s thermal performance. Different games exert varying loads on your GPU, and if your CPU bottlenecks performance, your GPU might not reach full utilization, leading to falsely low temperature readings. For a definitive assessment, use Furmark, a synthetic stress test designed to push your GPU to its limits.
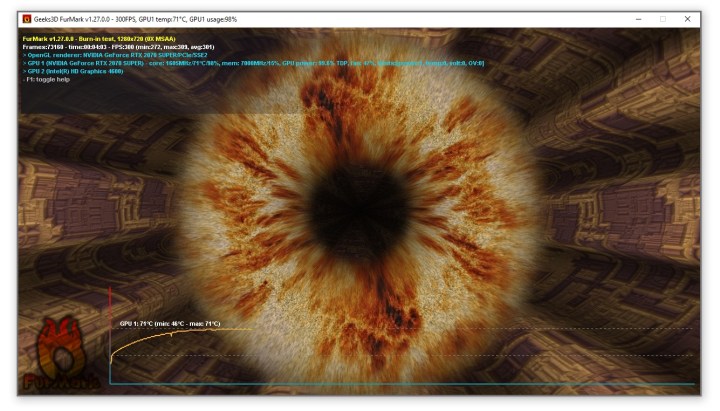 Furmark synthetic GPU torture test on RTX 2070 Super.Alt text: Screenshot of Furmark stress test running on an RTX 2070 Super graphics card.
Install Furmark, open it, and run the test with standard settings. Observe the temperature for 10-15 minutes until it stabilizes. Furmark displays real-time GPU clock speeds, temperatures, and other relevant data. Remember, Furmark is more demanding than most games, so expect higher temperatures and potentially lower clock speeds than during typical gameplay. While generally safe, monitor the temperature closely and ensure it doesn’t exceed 90 degrees Celsius.
Understanding GPU Target Temperatures and Potential Issues
Most modern GPUs have a target temperature of 82-85 degrees Celsius. They will either overclock until they reach this temperature or until they hit their maximum overclock. This allows the GPU to maximize performance when thermal headroom exists or reduce fan speeds for quieter operation when the power limit is reached. A temperature below 80 degrees Celsius is generally ideal. However, a temperature at or near 85 degrees Celsius could indicate a problem. GPUs can underclock themselves to prevent overheating, so if your GPU is consistently at 85 degrees Celsius and the clock speed is significantly lower than the advertised base clock, further investigation is needed. Also note that some monitoring tools display a “junction temperature,” which represents the hottest point on the GPU. While this reading might be higher than the core temperature, it’s usually not a cause for concern unless you’re aggressively overclocking.
Troubleshooting High GPU Temperatures
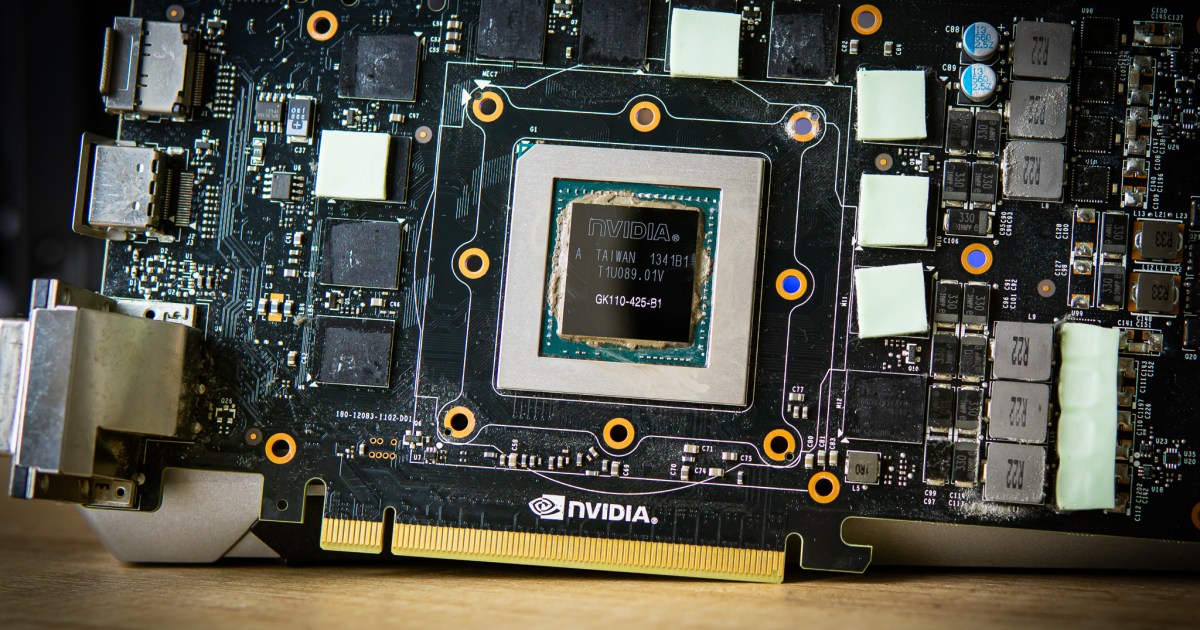
If your GPU runs consistently at or above 85 degrees Celsius with lower-than-expected clock speeds, ensure adequate airflow within your PC case and clean any dust filters. Check the GPU heatsink for dust buildup and clean it if necessary. Update or reinstall your GPU drivers. If the problem persists, there might be poor thermal contact between the cooler and the GPU core due to a factory defect or dried-out thermal paste. Thermal paste degrades over time, and replacing it after two to four years can significantly improve cooling performance.
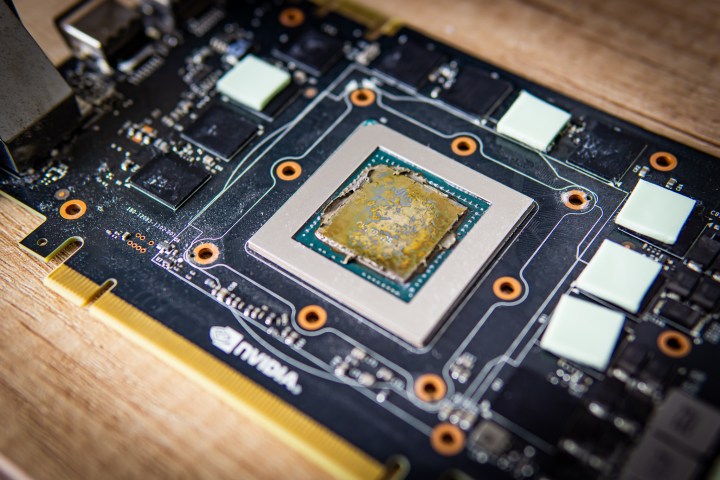 Bad thermal paste on 780 Ti graphics card.Alt text: Close-up image of dried-out thermal paste on a GTX 780 Ti graphics card.
Replacing thermal paste requires disassembling the GPU, a procedure best left to experienced users. If you’re uncomfortable with this process, especially if your GPU is under warranty, contact the manufacturer or a local PC repair shop for assistance.
Conclusion: Keeping Your GPU Cool
Maintaining optimal GPU temperatures is essential for performance and longevity. By regularly monitoring your GPU temperature and addressing potential issues proactively, you can ensure your graphics card remains in top condition for years to come.

