A fast and responsive PC is essential for a smooth computing experience. We expect near-instant boot times, applications that open without delay, and videos that play seamlessly. But sometimes, things slow down. Your PC might crash unexpectedly, or simple tasks like file copying can take an unreasonably long time. Often, the culprit isn’t software but underlying hardware issues. Pinpointing the bottleneck can be tricky. Is a memory module faulty? Is the CPU overheating? Is your storage drive at its limit? Or is a slow internet connection the problem? This article will guide you through the process of identifying and addressing common PC performance bottlenecks.
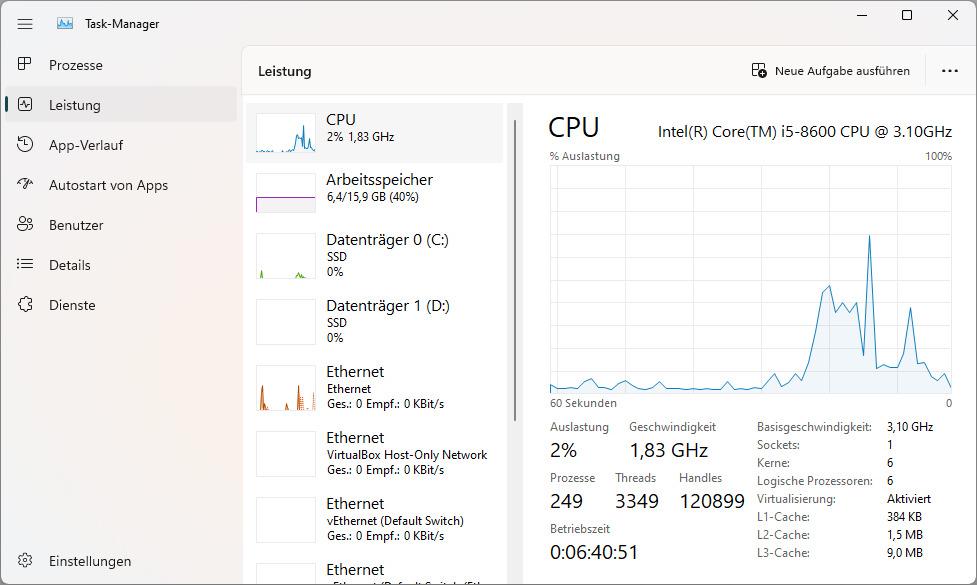 The Windows Task Manager provides data and statistics on key PC components in a clear and graphical format. It's your first stop for troubleshooting performance issues.
Starting with the Task Manager
The Windows Task Manager is a powerful tool for monitoring performance. Microsoft has significantly improved its functionality in recent years, making it an invaluable resource for troubleshooting.
To open the Task Manager, press Ctrl+Alt+Del and select “Task Manager.” Alternatively, type “task” into the Windows search bar. In the Task Manager window, click “Settings” in the bottom-left corner and enable “Always on top.” Next, navigate to the “Performance” tab and examine the CPU, Memory, GPU, Ethernet, and/or Wi-Fi tabs individually. Keep the Task Manager open while performing your usual tasks and observe the resource utilization for each component. If any component consistently exceeds 80% utilization, it indicates a potential bottleneck.
Monitoring CPU Temperature and Performance with Core Temp
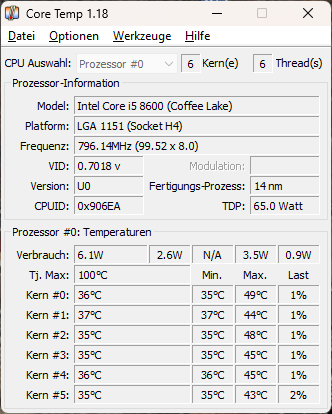 Core Temp, a freeware tool, displays the current temperatures of individual CPU cores.
Frequent crashes or significant slowdowns can often be attributed to an overheating CPU. A poorly fitted or malfunctioning CPU fan can be the underlying cause. The processor’s built-in protection circuitry reduces the clock speed when temperatures rise sharply. If this isn’t sufficient, the CPU shuts down to prevent damage, leading to unexpected PC crashes.
Core Temp, a freeware utility, allows you to monitor CPU temperature. It maintains an updated database of AMD and Intel processors, displaying relevant data upon launch. It shows individual core temperatures both within its interface and in the system tray. The Core Temp window displays the maximum permissible operating temperature (Tj. Max) along with current core temperatures. Consistently high temperatures (above 80°C) likely indicate a cooling problem. Check inside your PC to ensure the CPU fan is functioning correctly and is properly seated on the processor.
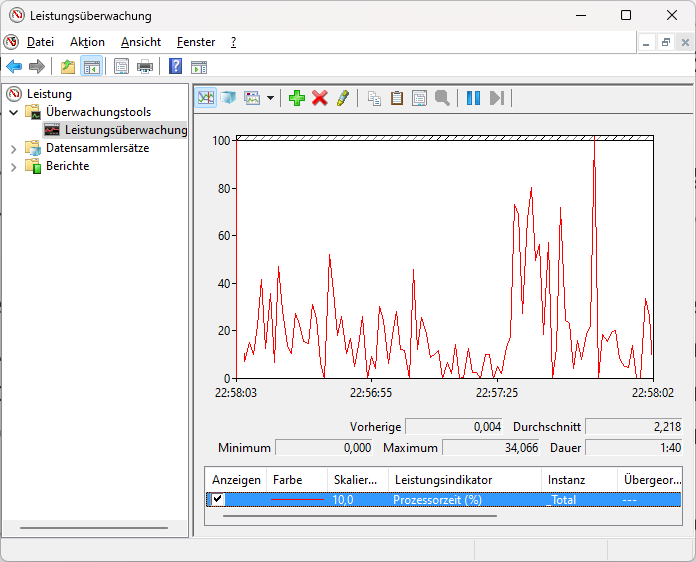 Windows Performance Monitor graphically tracks the percentage of processor time used by a thread (shown below).
If your PC feels sluggish, the CPU might be struggling to keep up, even without overheating. Observe the CPU utilization curve in the Task Manager. Windows Performance Monitor provides a more detailed view. Access it by typing “perfmon” in the search bar. Navigate to Performance > Monitoring Tools > Performance Monitor. This displays a real-time graph, with processor time shown at the bottom. This value represents the time the CPU spends executing a thread (a specific program action, such as typing in a word processor, saving a file, or printing). Lower processor time per thread is ideal. If this value consistently exceeds 80-90%, your CPU might be a bottleneck and could benefit from an upgrade.
Diagnosing RAM Issues with Memtest
Recurring crashes can also stem from faulty RAM. Defects due to manufacturing flaws or overheating can occur. If memory addresses become inaccessible, Windows can crash.
Memtest is a free utility for checking RAM for errors. However, since Windows cannot access memory already in use, Memtest can only test free RAM. Reboot your computer and run Memtest immediately, before launching any other applications. As Windows dynamically allocates memory, Memtest will eventually test the entire RAM.
Memtest can test up to 3.5GB of contiguous memory. Check the Task Manager (Performance > Memory) to see how much RAM is available and divide the value (in MB) by 2000. This determines the number of Memtest instances you should run simultaneously, allocating 2000MB to each instance. Run each instance until it reaches 100% coverage. According to the developer, this detects 95% of memory errors. If Memtest detects an error, it will stop and display a message. In this case, replacing the faulty RAM module is recommended.
Checking Graphics Card Temperature and Functionality
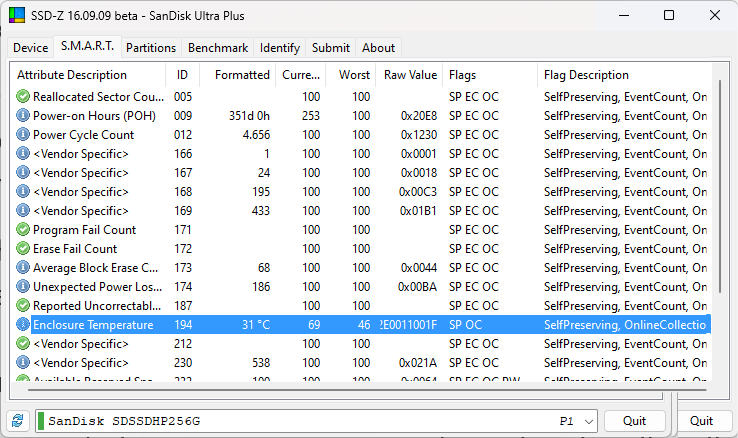 SSD-Z reads the S.M.A.R.T. data of your SSD or hard drive, identifying read/write errors.
The graphics card (GPU) can also cause crashes, especially under heavy load, such as during gaming. Overheating and memory errors can occur.
Monitor GPU temperature in the Task Manager (Performance > GPU). GPU-Z, a free utility, offers more detailed hardware information. As a general rule, GPU temperature should stay below 80°C to avoid potential hardware damage. If GPU-Z reports higher temperatures, check the graphics card fan for proper operation and secure mounting. Fan replacement feasibility depends on the specific graphics card model.
OCCT can perform a GPU memory test. Select Test > VRAM in the OCCT interface. Choose the correct graphics card and test duration (the default 30 minutes is usually sufficient). Click the start button. If OCCT detects memory errors, replacing the graphics card is likely necessary.
If games run slowly or exhibit low frame rates, the GPU might simply be overtaxed. 3DMark is a popular benchmarking tool, but the free demo version has limited functionality.
Investigating Slow File Transfers
If Windows boot times are unusually long, even with an SSD, investigate your storage drive. CrystalDiskMark is a reliable speed testing tool. It performs multiple read/write tests and reports the results. Significantly low values warrant further investigation. CrystalDiskMark supports HDDs, SSDs, USB drives, and flash drives.
SSD-Z provides more in-depth analysis, displaying technical data, temperature, and S.M.A.R.T. values for your storage drive. It also includes a benchmark, but it’s less precise than CrystalDiskMark.

